
Google Analytics is a comprehensive tool that analyzes how people interact with your brand’s websites, apps, and more. From goals and conversions, to traffic and behavior flow, there are so many tools available to you with Google Analytics that the whole thing can be quite intimidating. However, by mastering a few key skills, you’ll harness the power of Google Analytics to optimize the way you interact with potential and existing customers.
In this blog, we discuss the skills you must develop in order to take full advantage of what Google Analytics has to offer. We also show how you could achieve exponential growth in Google Analytics in year-over-year revenue.
1. Learn Which Data to Highlight and Which to Ignore
While Google Analytics offers incredible insights into how web traffic interacts with your brand, it’s important to realize that not all metrics matter. In fact, many people make the mistake of focusing exclusively on "vanity metrics.” Vanity metrics are things like web traffic, but they are not as meaningful as your Key Performance Indicators (KPIs).
KPIs reveal much more than the number of visits to your website. They reveal things like audience, conversion rate, acquisition, and more. These metrics measure your progress relative to your goals, show you how your business’s web traffic is performing, and how your website can be improved.
2. Learn How to Use “Goals” to Measure Conversion
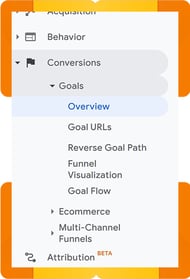
Goals are events or tasks that you set for a user to complete (e.g. a purchase, submitting contact info, etc.). Once completed, these goals are called “conversions.” Achieving a high conversion rate is the most important objective of your business’s website, no matter what your objectives are.
Another thing to consider is how you can measure conversions in terms of monetary gain. A great way to do this in Google Analytics is to assign a monetary value to your goals. That way, you can estimate the amount of revenue different goals generate for your business.
3. Customize and Configure Google Analytics to Meet Your Needs
Once you learn how to navigate Google Analytics, it’s important to optimize your account to ensure you're measuring the metrics that matter. Start with our Google Analytics setup checklist:
- Set up event tracking
- Set up campaign tracking
- Set up e-commerce analytics
- Get demographics reports
- Apply attribution modeling
Note that for other functions, such as keyword tracking, you'll need to leverage other tools -- such as the Google Search Console alongside plug-ins or platforms like Ahrefs -- that really let you take a deep dive into SEO data analysis.
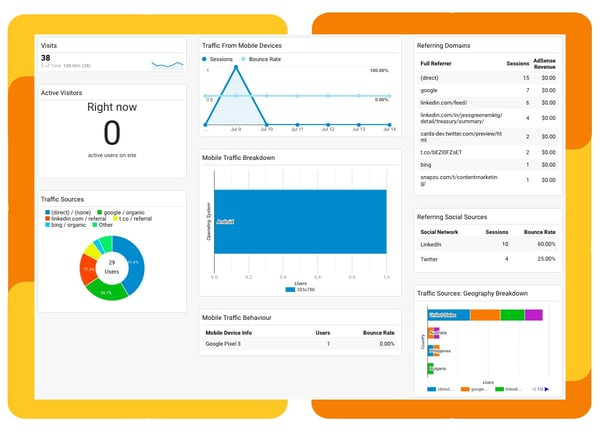
4. Create Custom Dashboards and Reports
Google Analytics allows users to create up to 20 dashboards that allow them to quickly access their most critical data and metrics. In order to access the most important data, you should spend time creating dashboards that allow you to analyze various KPIs. Five to ten dashboards should be enough to give you a clear view of your most valuable metrics.
In addition to customizable dashboards, Google Analytics provides users with a “solutions gallery” that includes a number of preconfigured dashboards. These dashboard templates will often suit your needs and will save time versus developing a dashboard from scratch.
5. Continually Monitor Reports and Change Your Strategy Accordingly
Review your reports on a regular basis in order to make decisions based on changing metrics. Merely setting up custom reports and dashboards is not enough to optimize your business’s online presence -- you have to actually utilize that info! Reviewing your main KPIs weekly will keep you in the know about your website’s performance. In addition to weekly checks, it’s important to keep a close eye on reports after a major update or change to your website.
6. Compare Your Current Data to Historical Data
Google Analytics gives you the unique ability to compare data from different time ranges. This means that you have the ability to track performance and compare it to historic data. This will reveal trends that may have otherwise gone unnoticed. Retroactive, customizable analysis will allow you to ensure that positive changes are happening in the places that matter most. KPIs on their own are not enough to show improvement. Comparing KPIs from before and after an implemented change will illustrate whether that change was worthwhile.
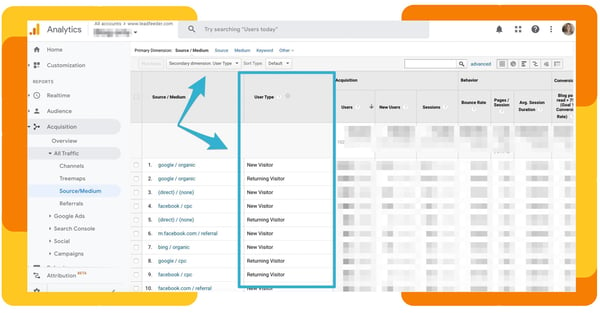 7. Take Full Advantage of Dimensions
Utilize the dimensions feature in Google Analytics to drill down to specific metrics for an array of variables. For example, if you want to see which area of the United States views your website the most, you can do that. From country, to region, to city, you can obtain exact metrics about your users. This is your “primary” dimension, or more simply, the first criterion of the data you’re trying to observe.
The secondary dimension is a feature that allows you to narrow the metrics even further. Say you want to see web traffic in a specific area, but you also want to see a breakdown based on which web browser these users are on. You can accomplish this with the secondary dimension feature. Additionally, if you want to save all of these custom dimensions and criteria, you can do that. So, the next time you want to access this report, you can create a shortcut that allows you to see this exact breakdown right away.
8. Get Ultra-Specific with Segments
Segments, like dimensions, allow you to isolate a specific group of users in Google Analytics. However, unlike dimensions, segments allow you to review how a specific group “performs” compared to other groups. This powerful tool goes far beyond simple comparisons. Here are some examples of what segments can do:
- Create a class of visitors based on conversion. This will allow you to optimize goals based on the details of how these users behave.
- Utilize the Recency-Frequency-Monetary Value (RFM) segment to find who your “high-value” customers are (HVCs). These customers are more likely to purchase again, so it’s important to keep track of their behavior.
- Find out how successful a marketing campaign was by measuring the number of visitors who interacted with your website. You can also measure conversion during a specific time frame to identify the most successful tactics.
Segments offer a level of analysis that will help you maximize interaction and conversion. By observing the specific behavior of various segments of your web traffic, you can learn where to put the most resources.
9. Use Filtering to Prevent Reporting Traffic from Company IP addresses
Something that you may have noticed when studying reports is that your own office’s IP address appears over and over again. This is because you and your team frequently visit the website for maintenance. This can cause some disruption in your analytics. Luckily, Google added a feature that allows you to exclude your own IP addresses. Additionally, you can configure Google Analytics to ignore parts of the website that are reserved for internal use.
10. Create Custom Alerts
While it’s important to review KPIs as a metric for how well your website is performing, it isn’t always possible to catch every little thing. Luckily, automated, custom alerts can be set up to catch key changes as soon as they occur. These alerts can be edited to activate under a wide array of circumstances so you can get some peace of mind. Even if you miss something, a custom alert will catch it before it goes unnoticed.
Google Analytics can be intimidating to those not familiar with it. The many options and metrics, while powerful, can also be intimidating if you don’t know how to read or make use of them. We help clients set up their websites, and part of that is helping them setup and understand how to use Google Analytics. Get in touch with us today to learn how this and other powerful tools can help you get the most out of your website traffic.